Measurement
Separating refrigeration, HVAC and lighting consumption.
Refrigeration, opening hours and differences across the store network.
30-minute introductory discussion · no obligation
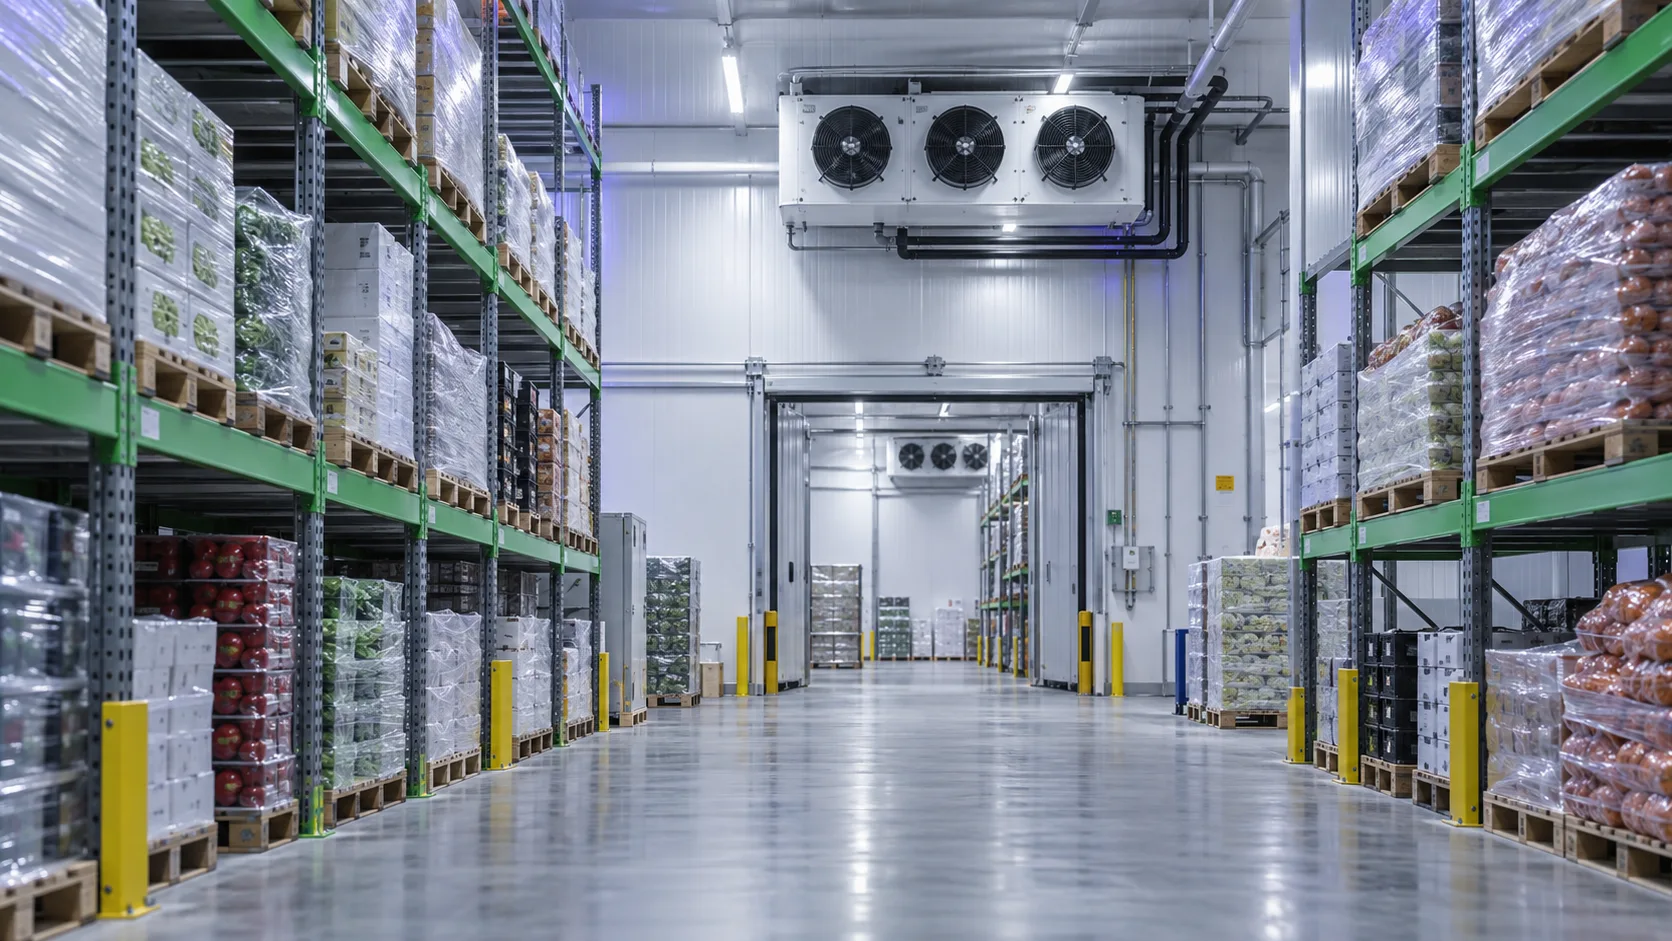
Scepi Smart EMS brings refrigeration, lighting and building-services data from food stores and retail networks into a shared view. Individual stores can be compared using their opening hours, floor area and refrigerated capacity alongside consumption.
Separating refrigeration, HVAC and lighting consumption.
Identifying baseload and unusual operation outside opening hours.
Comparing stores using appropriate measures of usage and size.
Central reporting and event handling assigned to local responsible staff.
Compare like-for-like operating periods and investigate changes before attributing them to an energy action.
Refrigeration deviations and alarm response time. Sensor and data-source compatibility is assessed during scoping.
Smart EMS brings accessible meter and operating data together. Monitor provides visibility; Executive supports analysis and reporting; Autopilot adds approved control. Interfaces, alerts, retention and integrations are scoped for the site.
Explore the platform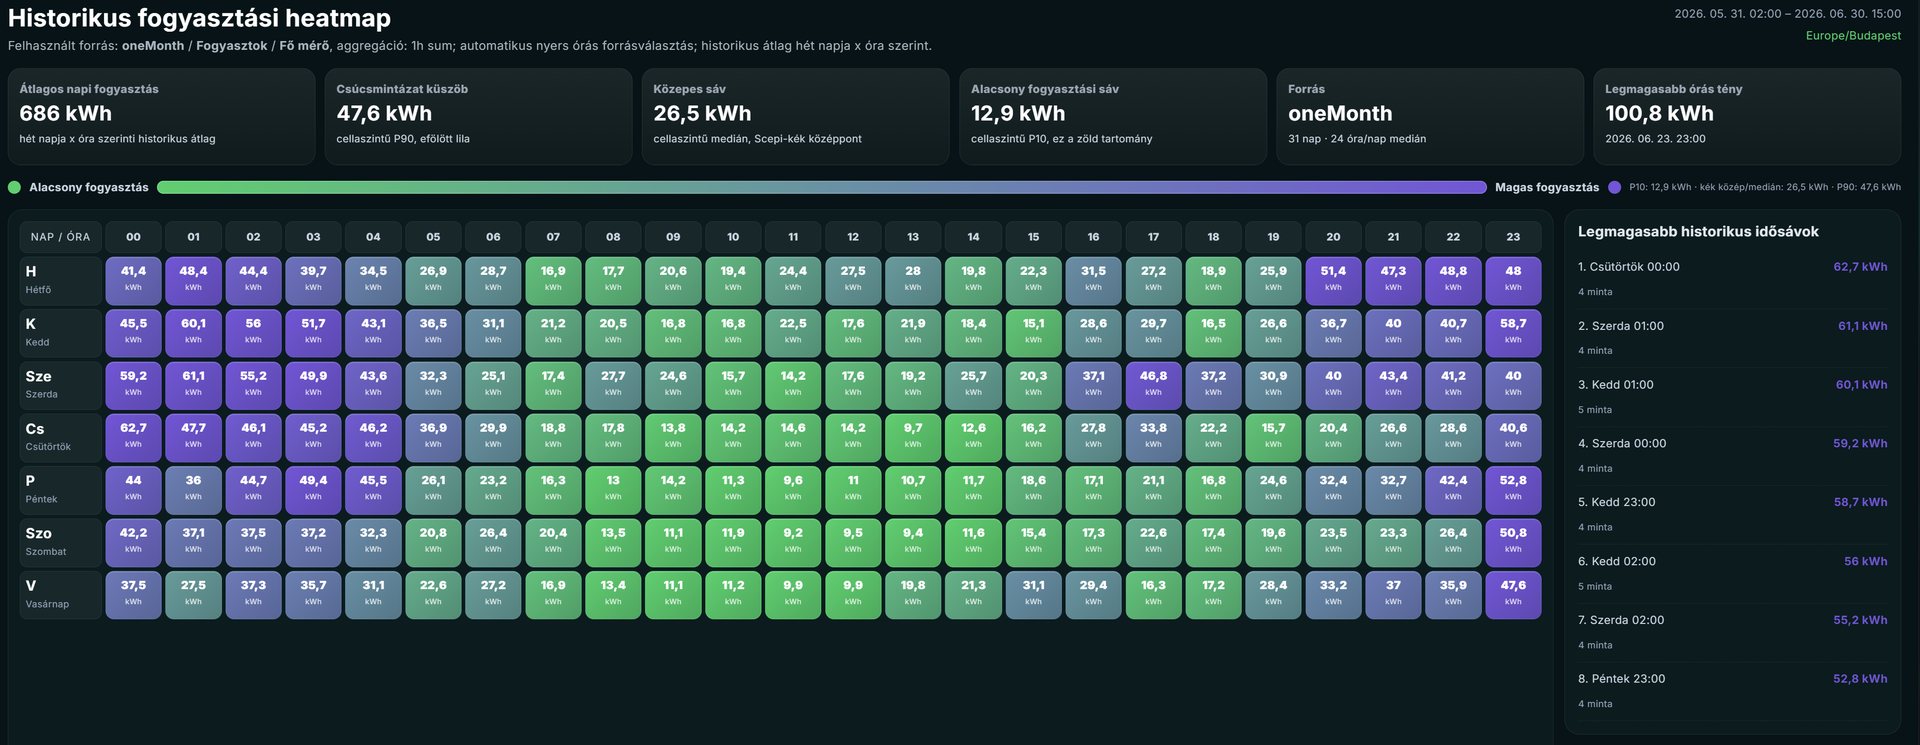
The same software tiers apply across industries. Industry-specific sensors, interfaces and workflows are implemented as a separate project.
A shared view of site consumption, production and basic energy costs.
Plan details and scopeAnalysis, exports, forecasts and reports to support decisions.
Plan details and scopeApproved automatic control within agreed operating limits.
Plan details and scopeHardware, implementation, operations and optional modules are separate costs. Prices are net of VAT. Full comparison
Annual energy cost, excluding VAT, for the stores in scope, separated by site.
The starting figures are editable examples, not measured customer data or promised savings. All amounts are net of VAT, in Hungarian forints.
Assumed savings minus annual software and other recurring costs.
The estimated annual net benefit is positive.
With the entered water savings; excluding the one-off investment.
| Assumption | Annual net benefit |
|---|---|
| Half the entered rate | 151,000 HUF |
| The entered rate | 601,000 HUF |
| 1.5 times the entered rate | 1,051,000 HUF |
Uses 50%, 100% and 150% of the entered energy and water saving rates, capped at 100% savings. A sensitivity analysis, not a forecast.
Annual net benefit = energy cost × energy saving rate + water cost × water saving rate − annual licence − other annual costs. Payback = one-off investment / annual net benefit. First-year ROI = (annual net benefit − one-off investment) / one-off investment × 100%.
The model assumes constant annual costs and savings. It excludes financing, tax, inflation, discounting and residual value. Measurement supports decisions; savings require validated actions and follow-up measurement. Food safety, process and operational limits take priority.
List prices checked: 28 September 2026. Plans and included services.
Verified reductions from aligning operation with opening hours. Resolving investigated anomalies within comparable store groups.
The calculator includes only the energy and water cost buckets entered above. Capacity, avoided damage and other value must be evaluated separately from evidence.
We define the decision to support, the data needed and the operating limits before implementing the integration.
Meter list, interfaces, responsibilities and a comparable baseline.
Connect the required data, test timestamps, gaps and alerts.
Approve any control rules, test fallback and manual override, then measure results against the agreed baseline.
Yes, with appropriate grouping and normalised indicators. In addition to floor area, comparisons need to account for opening hours, refrigerated capacity, weather and significant differences in equipment and processes.
Central monitoring and agreed control functions can be designed around available access and equipment interfaces. Local safety functions and authorised local overrides form part of the design.
The basic calculation starts with changes in energy cost and the costs of the system. Product-waste or stock-protection effects can only be assessed separately using documented occurrences and costs excluding VAT.
Monitor, Executive and Autopilot are annual per-site software licences. Meters, hardware, integration, implementation, operations and optional modules are separately scoped and priced. The calculator uses the published licence prices and editable project budgets.
Bring an energy bill, a meter list and the operating question you want to resolve. We can use them to define a practical first step.
30-minute introductory discussion · no obligation
Content and public licence prices reviewed: 28 September 2026. · Scepi Consulting
Refrigeration, opening hours and differences across the store network.
30-minute introductory discussion · no obligation
Scepi Smart EMS brings refrigeration, lighting and building-services data from food stores and retail networks into a shared view. Individual stores can be compared using their opening hours, floor area and refrigerated capacity alongside consumption.
Separating refrigeration, HVAC and lighting consumption.
Identifying baseload and unusual operation outside opening hours.
Comparing stores using appropriate measures of usage and size.
Central reporting and event handling assigned to local responsible staff.
Compare like-for-like operating periods and investigate changes before attributing them to an energy action.
Refrigeration deviations and alarm response time. Sensor and data-source compatibility is assessed during scoping.
Smart EMS brings accessible meter and operating data together. Monitor provides visibility; Executive supports analysis and reporting; Autopilot adds approved control. Interfaces, alerts, retention and integrations are scoped for the site.
Explore the platformThe same software tiers apply across industries. Industry-specific sensors, interfaces and workflows are implemented as a separate project.
A shared view of site consumption, production and basic energy costs.
Plan details and scopeAnalysis, exports, forecasts and reports to support decisions.
Plan details and scopeApproved automatic control within agreed operating limits.
Plan details and scopeHardware, implementation, operations and optional modules are separate costs. Prices are net of VAT. Full comparison
Annual energy cost, excluding VAT, for the stores in scope, separated by site.
The starting figures are editable examples, not measured customer data or promised savings. All amounts are net of VAT, in Hungarian forints.
Assumed savings minus annual software and other recurring costs.
The estimated annual net benefit is positive.
With the entered water savings; excluding the one-off investment.
| Assumption | Annual net benefit |
|---|---|
| Half the entered rate | 151,000 HUF |
| The entered rate | 601,000 HUF |
| 1.5 times the entered rate | 1,051,000 HUF |
Uses 50%, 100% and 150% of the entered energy and water saving rates, capped at 100% savings. A sensitivity analysis, not a forecast.
Annual net benefit = energy cost × energy saving rate + water cost × water saving rate − annual licence − other annual costs. Payback = one-off investment / annual net benefit. First-year ROI = (annual net benefit − one-off investment) / one-off investment × 100%.
The model assumes constant annual costs and savings. It excludes financing, tax, inflation, discounting and residual value. Measurement supports decisions; savings require validated actions and follow-up measurement. Food safety, process and operational limits take priority.
List prices checked: 28 September 2026. Plans and included services.
Verified reductions from aligning operation with opening hours. Resolving investigated anomalies within comparable store groups.
The calculator includes only the energy and water cost buckets entered above. Capacity, avoided damage and other value must be evaluated separately from evidence.
We define the decision to support, the data needed and the operating limits before implementing the integration.
Meter list, interfaces, responsibilities and a comparable baseline.
Connect the required data, test timestamps, gaps and alerts.
Approve any control rules, test fallback and manual override, then measure results against the agreed baseline.
Yes, with appropriate grouping and normalised indicators. In addition to floor area, comparisons need to account for opening hours, refrigerated capacity, weather and significant differences in equipment and processes.
Central monitoring and agreed control functions can be designed around available access and equipment interfaces. Local safety functions and authorised local overrides form part of the design.
The basic calculation starts with changes in energy cost and the costs of the system. Product-waste or stock-protection effects can only be assessed separately using documented occurrences and costs excluding VAT.
Monitor, Executive and Autopilot are annual per-site software licences. Meters, hardware, integration, implementation, operations and optional modules are separately scoped and priced. The calculator uses the published licence prices and editable project budgets.
Bring an energy bill, a meter list and the operating question you want to resolve. We can use them to define a practical first step.
30-minute introductory discussion · no obligation
Content and public licence prices reviewed: 28 September 2026. · Scepi Consulting