Which process consumes energy?
Breakdowns by site, machine group, shift or building zone. Linking the main meter and submeters can also make unallocated consumption visible.
Energy management · Energy controlling
Connect consumption with production, operating hours and costs. Alongside the monthly total, you can then see which processes are worth investigating and how to track the effect of an action.
Energy per product during the period under review
Energy controlling examines measured consumption in its operational context. Energy data from Scepi Smart EMS, accessible machine and plant data, and agreed business data can provide a common basis for analysis. The aim is an overview that shows where costs arise, what causes deviations and what needs checking.
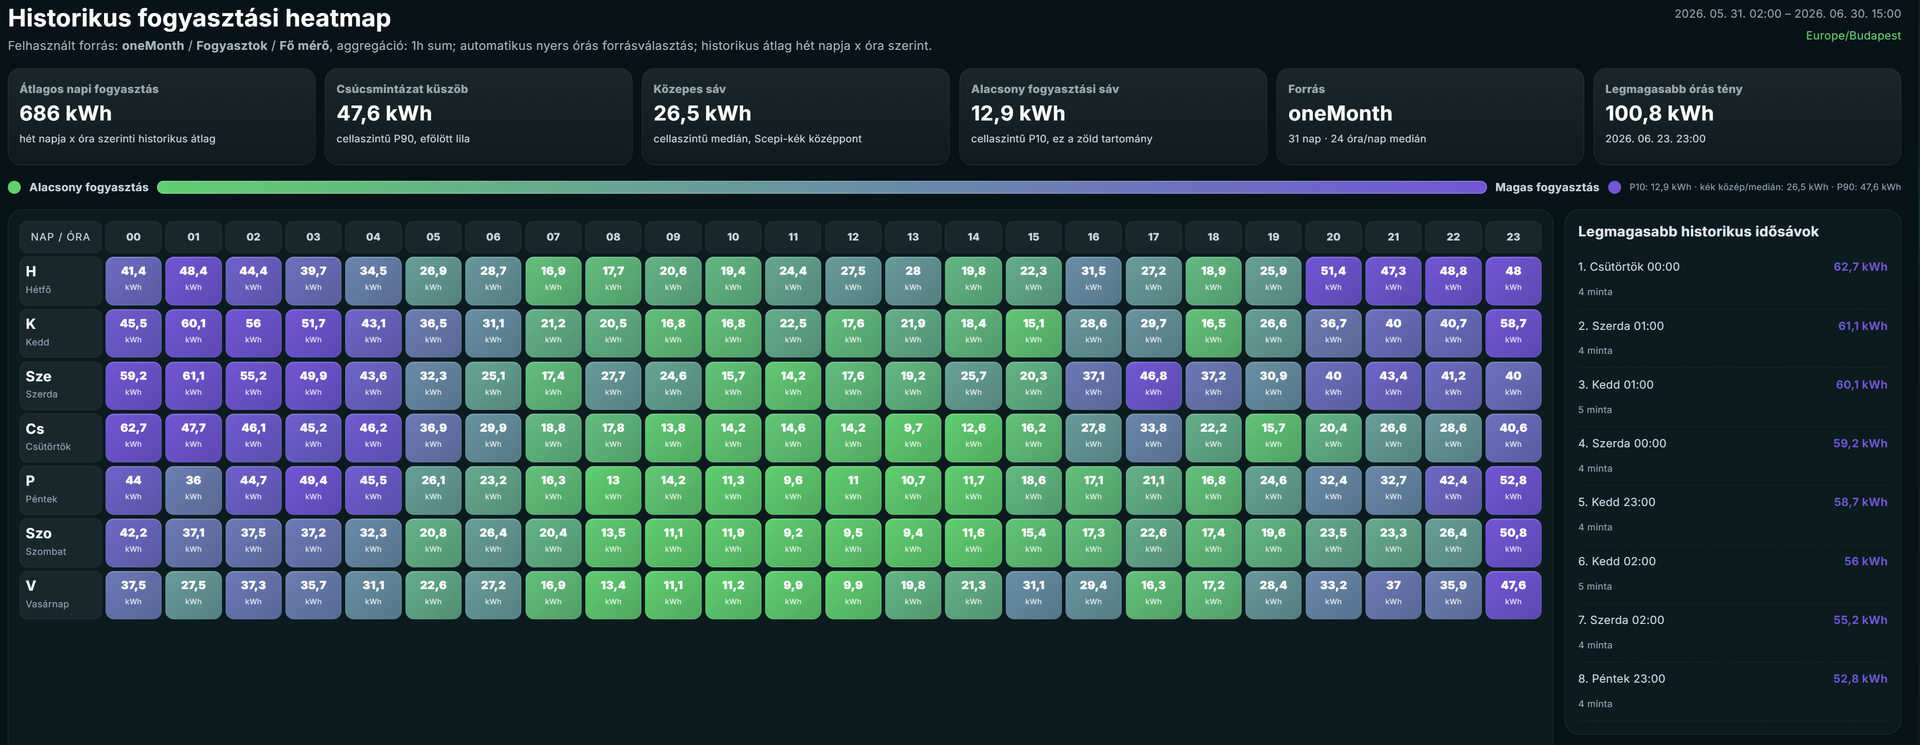
The operations behind the bill
The same monthly energy consumption can correspond to different levels of operational output. Quantity, price and operating conditions all matter for a sound comparison.
Breakdowns by site, machine group, shift or building zone. Linking the main meter and submeters can also make unallocated consumption visible.
Were more products made, were operating hours longer, did the product mix change, or did the energy price change? These factors are worth examining separately before drawing conclusions about efficiency.
A recorded baseline, a documented intervention and a comparable follow-up period. This provides a traceable explanation alongside the chart.
Specific consumption and cost
We choose the indicator to suit the process. The numerator and denominator should refer to the same period and a clearly defined measurement boundary.
Consumption of a machine group or process relative to production during the given period. We must specify whether the calculation uses all products or only good products, and how the product mix is handled.
For pumping, for example, consumption relative to the volume of water pumped. Pumping head, pressure and operating state can also affect the value.
Consumption per operating hour indicates average power demand. Treating production, standby and shutdown periods separately can reveal persistent loads.
Based on consumption and the documented cost model. Energy prices, network usage charges and demand charges must be handled according to the applicable contract.
A simple, fictional example
10 000 kWh / 10 000 units
1,00 kWh/unit
9 900 kWh / 11 000 units
0,90 kWh/unit
Total consumption is 1% lower and energy per product is 10% lower, while the number of units increased by 10%.
Energy data integration
The consumption curve is easier to interpret when it can be linked to what was happening in the plant at the time. First, the meaning and quality of the data sources must be clarified.
Consumption, production volume, operating state, shift.
Time zone, sampling, gaps, counter rollover, meter replacement.
Measurement boundary, cost allocation, baseline and identified estimates.
Deviation, possible cause, responsible person and criteria for follow-up measurement.
Supported meters, PLC and BMS data can be integrated using connections such as Modbus, MQTT or REST API. The specific device, access and data point list require a prior technical review.
PLC data acquisition and operational reports →When incorporating production volume, cost centres or other ERP data, the authoritative source and mapping rules must be defined. A connection to Odoo or another system can be planned as a separately agreed integration, based on the available interface and permissions.
Odoo integration and data connections →Implementation with a defined scope
It could concern a machine group's specific consumption, the weekend baseload or the result of an action. We first select the measurement points and acceptance criteria to match.
What are we examining, over which period, and with which energy consumers and production data?
Checking sources, access, data quality and the baseline.
A documented formula, cost model, comparison and jointly verified output.
Responsible person, operational constraints, follow-up measurement period and conditions for moving forward.
Frequently asked questions
Reliable analysis requires understanding both the system's capabilities and the limitations of the data.
Smart EMS can provide the basis for energy data and related analyses. This page presents the controlling approach and its connection to operational data. The available features depend on the selected package and the data connections implemented. Introducing Smart EMS →
Yes, if the existing data is sufficient for the chosen question. The assessment identifies where additional measurement or integration is needed. Analysis alone does not entail a control intervention; its conditions and approval must be recorded separately.
Not without prior site data and defined actions. Results depend on operations, energy prices, data quality and the changes implemented. The effect must be measured against an appropriate baseline under comparable conditions.
No. Measurement data, indicators and action tracking can support this work, but data acquisition and reporting do not replace an audit or certification. ISO 50001 and energy measurement →
The package page details what is included in the annual, per-site Smart EMS software licence. Hardware, implementation, custom integration, support and operation are separate items. The full controlling process presented here is not automatically included with every licence. Current packages and terms →
The next step
Tell us about the site, which measurement and operational data is available, and which question you want to answer. This can help identify a meaningful first step.
A brief description of the task is enough for the first contact. Do not send passwords, access keys or confidential operational data.Energy management · Energy controlling
Connect consumption with production, operating hours and costs. Alongside the monthly total, you can then see which processes are worth investigating and how to track the effect of an action.
Energy per product during the period under review
Energy controlling examines measured consumption in its operational context. Energy data from Scepi Smart EMS, accessible machine and plant data, and agreed business data can provide a common basis for analysis. The aim is an overview that shows where costs arise, what causes deviations and what needs checking.
The operations behind the bill
The same monthly energy consumption can correspond to different levels of operational output. Quantity, price and operating conditions all matter for a sound comparison.
Breakdowns by site, machine group, shift or building zone. Linking the main meter and submeters can also make unallocated consumption visible.
Were more products made, were operating hours longer, did the product mix change, or did the energy price change? These factors are worth examining separately before drawing conclusions about efficiency.
A recorded baseline, a documented intervention and a comparable follow-up period. This provides a traceable explanation alongside the chart.
Specific consumption and cost
We choose the indicator to suit the process. The numerator and denominator should refer to the same period and a clearly defined measurement boundary.
Consumption of a machine group or process relative to production during the given period. We must specify whether the calculation uses all products or only good products, and how the product mix is handled.
For pumping, for example, consumption relative to the volume of water pumped. Pumping head, pressure and operating state can also affect the value.
Consumption per operating hour indicates average power demand. Treating production, standby and shutdown periods separately can reveal persistent loads.
Based on consumption and the documented cost model. Energy prices, network usage charges and demand charges must be handled according to the applicable contract.
A simple, fictional example
10 000 kWh / 10 000 units
1,00 kWh/unit
9 900 kWh / 11 000 units
0,90 kWh/unit
Total consumption is 1% lower and energy per product is 10% lower, while the number of units increased by 10%.
Energy data integration
The consumption curve is easier to interpret when it can be linked to what was happening in the plant at the time. First, the meaning and quality of the data sources must be clarified.
Consumption, production volume, operating state, shift.
Time zone, sampling, gaps, counter rollover, meter replacement.
Measurement boundary, cost allocation, baseline and identified estimates.
Deviation, possible cause, responsible person and criteria for follow-up measurement.
Supported meters, PLC and BMS data can be integrated using connections such as Modbus, MQTT or REST API. The specific device, access and data point list require a prior technical review.
PLC data acquisition and operational reports →When incorporating production volume, cost centres or other ERP data, the authoritative source and mapping rules must be defined. A connection to Odoo or another system can be planned as a separately agreed integration, based on the available interface and permissions.
Odoo integration and data connections →Implementation with a defined scope
It could concern a machine group's specific consumption, the weekend baseload or the result of an action. We first select the measurement points and acceptance criteria to match.
What are we examining, over which period, and with which energy consumers and production data?
Checking sources, access, data quality and the baseline.
A documented formula, cost model, comparison and jointly verified output.
Responsible person, operational constraints, follow-up measurement period and conditions for moving forward.
Frequently asked questions
Reliable analysis requires understanding both the system's capabilities and the limitations of the data.
Smart EMS can provide the basis for energy data and related analyses. This page presents the controlling approach and its connection to operational data. The available features depend on the selected package and the data connections implemented. Introducing Smart EMS →
Yes, if the existing data is sufficient for the chosen question. The assessment identifies where additional measurement or integration is needed. Analysis alone does not entail a control intervention; its conditions and approval must be recorded separately.
Not without prior site data and defined actions. Results depend on operations, energy prices, data quality and the changes implemented. The effect must be measured against an appropriate baseline under comparable conditions.
No. Measurement data, indicators and action tracking can support this work, but data acquisition and reporting do not replace an audit or certification. ISO 50001 and energy measurement →
The package page details what is included in the annual, per-site Smart EMS software licence. Hardware, implementation, custom integration, support and operation are separate items. The full controlling process presented here is not automatically included with every licence. Current packages and terms →
The next step
Tell us about the site, which measurement and operational data is available, and which question you want to answer. This can help identify a meaningful first step.
A brief description of the task is enough for the first contact. Do not send passwords, access keys or confidential operational data.